9.2 Infrastructure health
OpenCRVS monitoring tools let you measure and view critical metrics such as available disk space, used memory and total CPU load. This information can be used to proactively increase the available resources when the demand increases. These metrics are collected by a tool called Metricbeat and stored in ElasticSearch.
Notice that these metrics are not stored indefinitely. The default installation of OpenCRVS keeps both the metric measurements and system logs only for 3 days. The rollover policy is configured in the infrastructure/monitoring/beats/rollover-policy.json file. This file can be overwritten in the country config Docker compose files

Available disk space
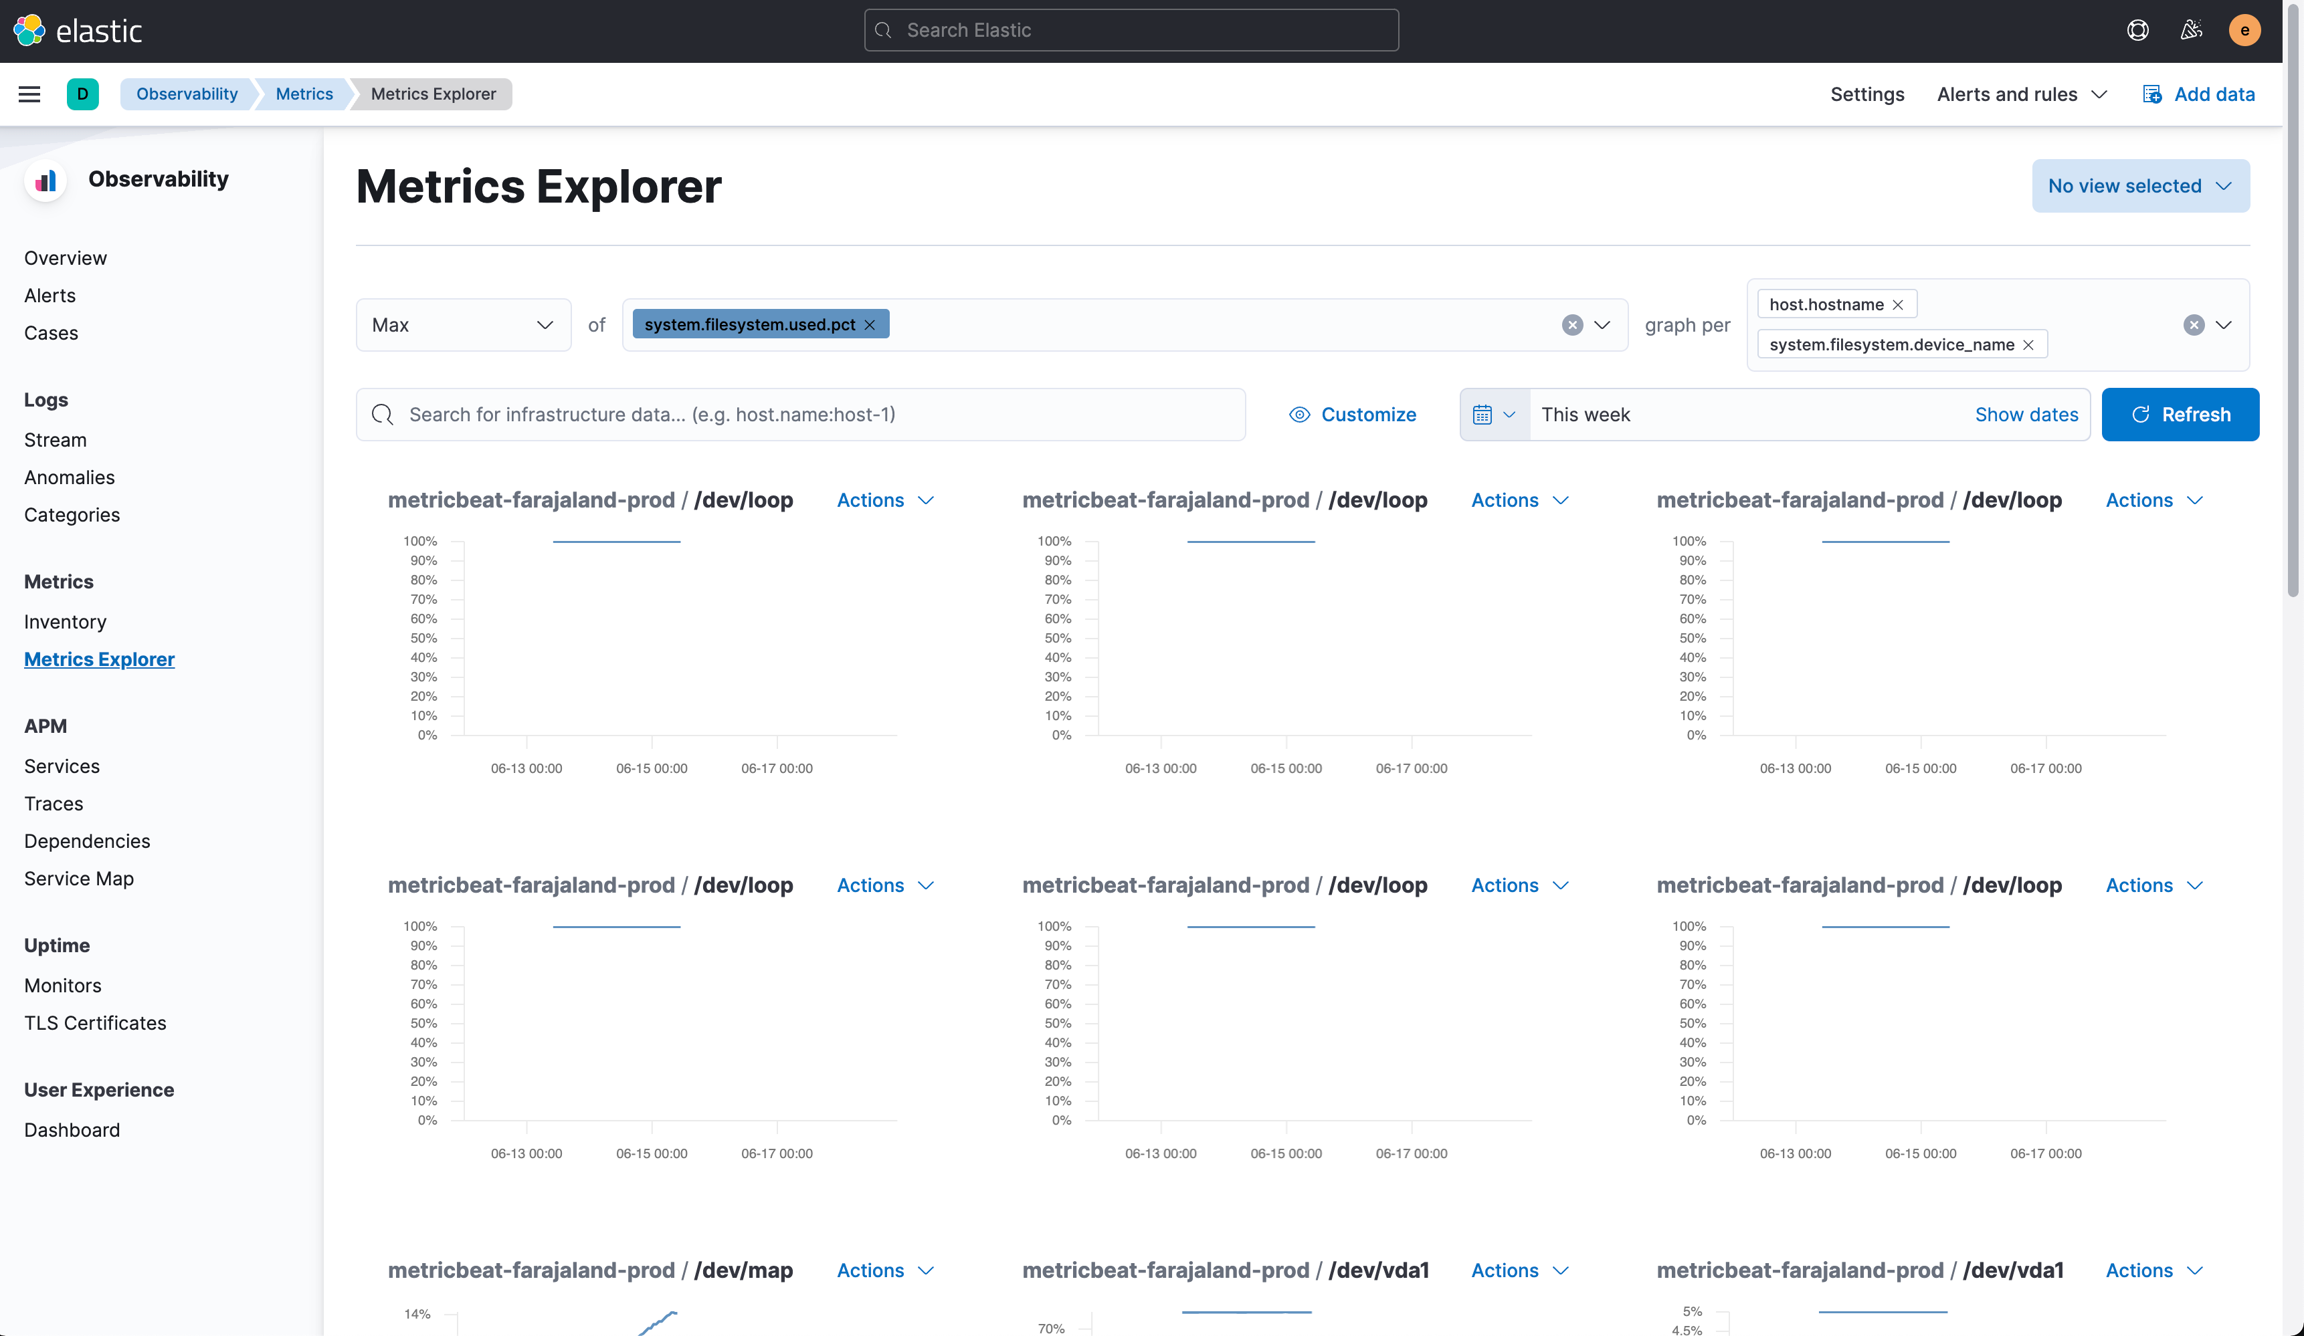
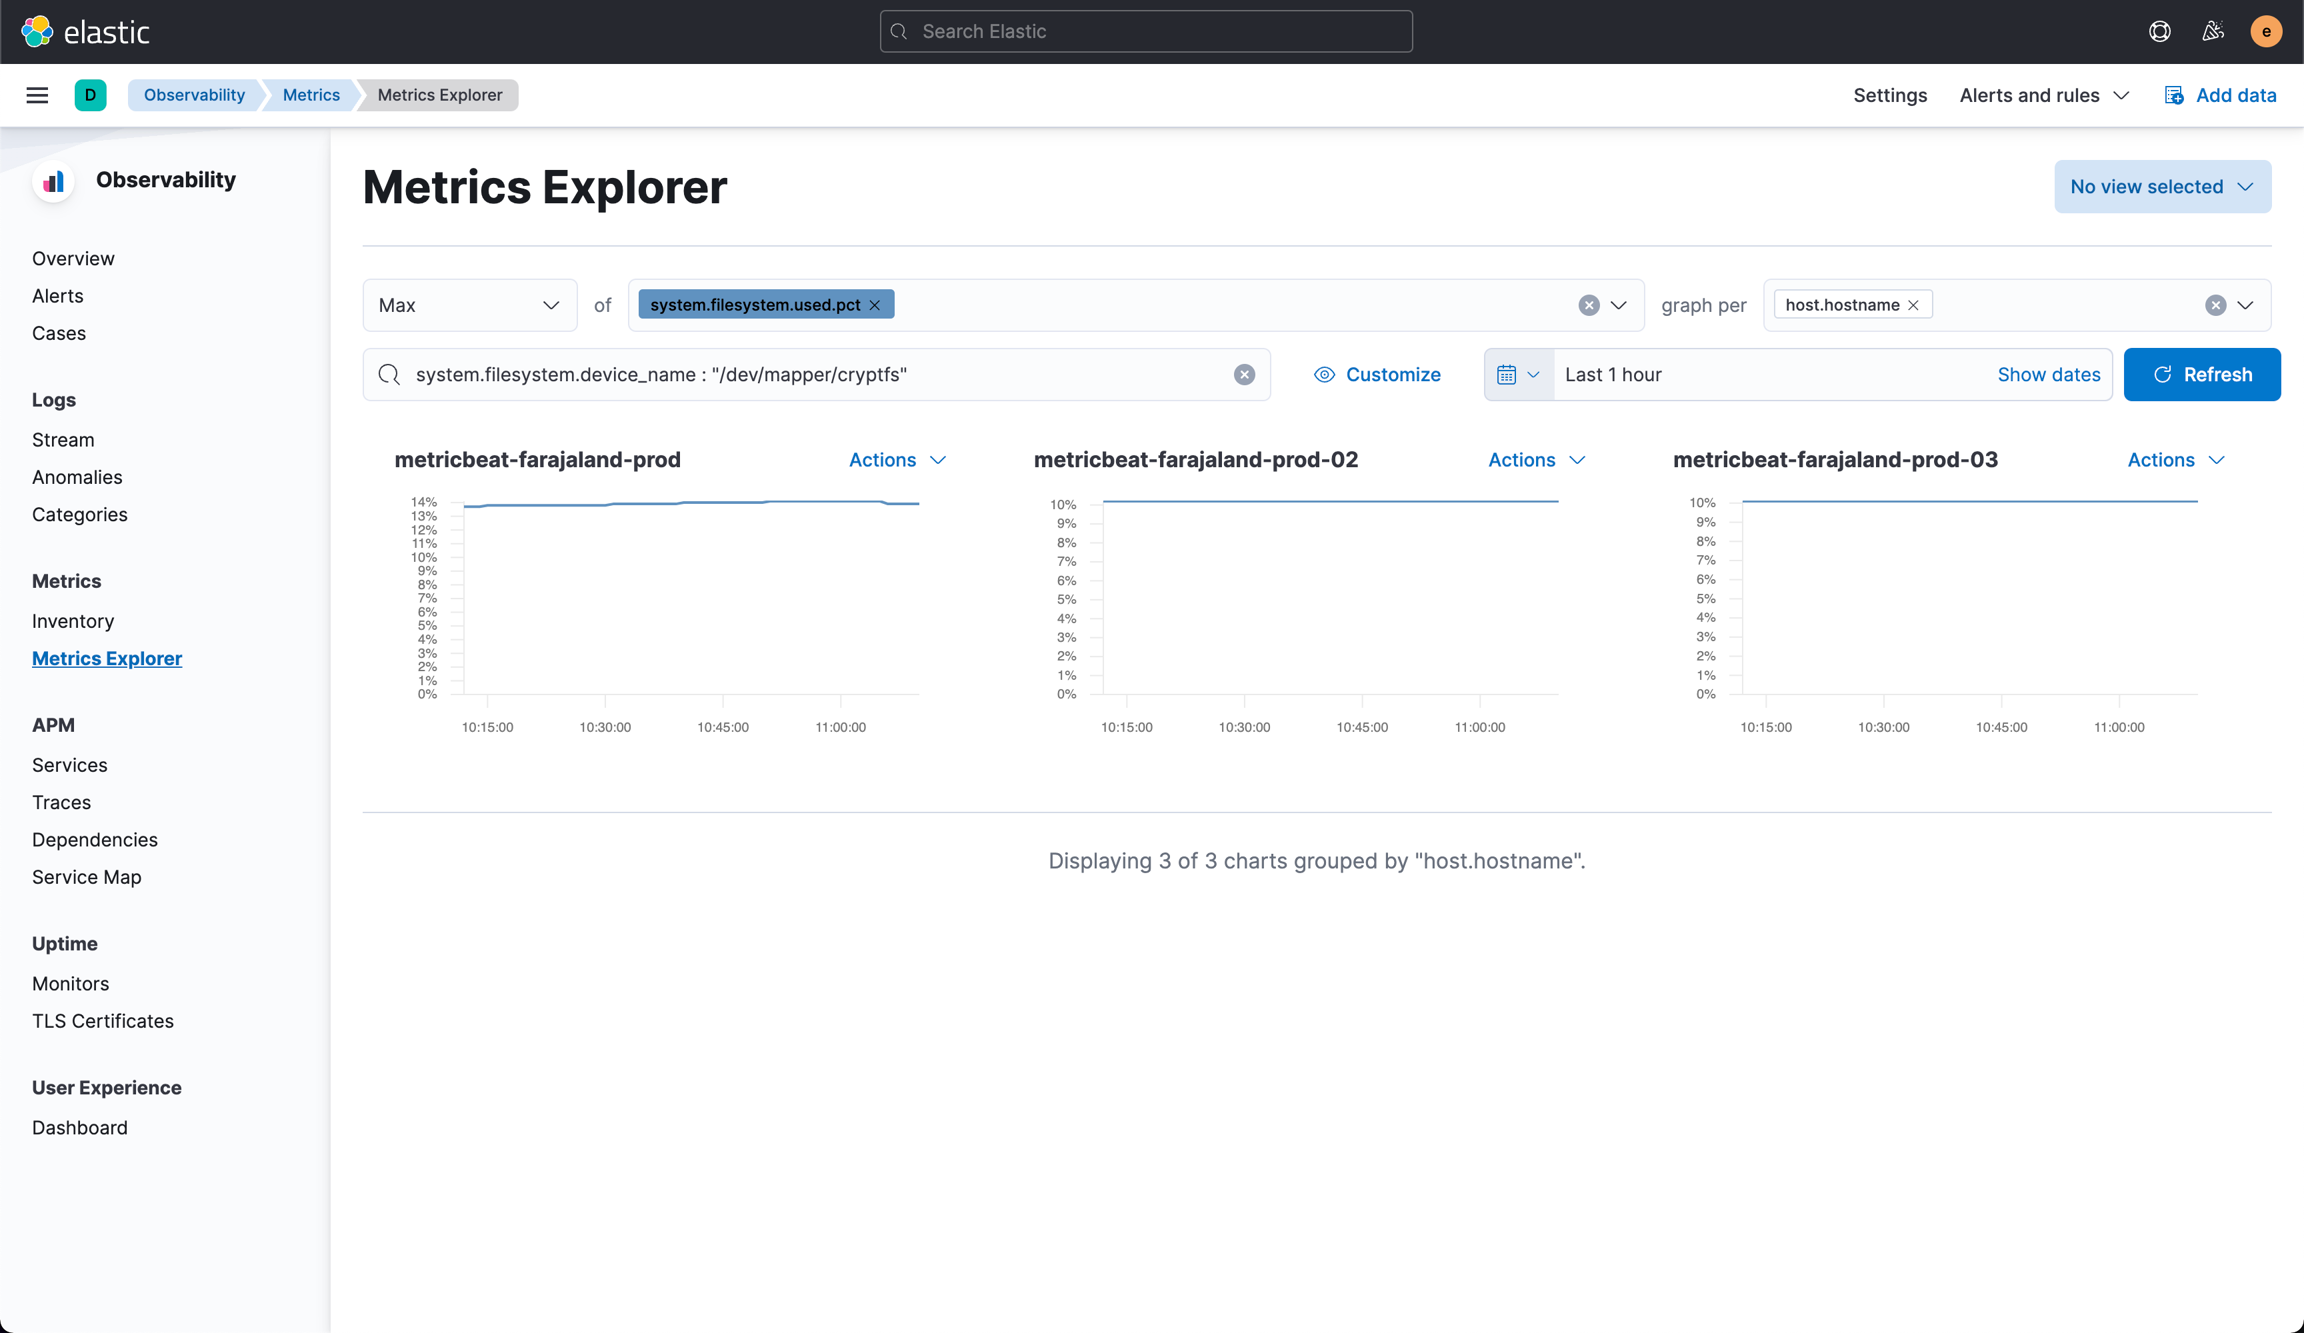
To see the amount of available disk space, navigate to Metrics Explorer (Observability -> Metrics -> Metrics Explorer). You can see the current usage of different storage devices by selecting a Max value of system.filesystem.used.pct grouped by host.hostname and system.filesystem.device_name

The default installation of OpenCRVS uses an encrypted disk for data storage on all nodes named /dev/mapper/cryptfs . You filter the listed devices to only show these disks by using the following search clause:
system.filesystem.device_name : "/dev/mapper/cryptfs"

Common infrastructure metrics
Available disk space
Max
system.filesystem.used.pct
host.hostname system.filesystem.device_name
system.filesystem.device_name : "/dev/mapper/cryptfs"
CPU usage
Average
system.process.cpu.total.pct
host.hostname
Memory usage
Max
docker.memory.usage.pct
host.hostname docker.container.labels.com_docker_swarm_service_name
Read more
Last updated