9.1 Application logs
All services in the OpenCRVS architecture emit logs that can be observed in real-time. The most common use case for viewing logs is debugging an issue with the installation. The logs from each service are collected automatically by Docker Swarm and sent to Kibana for developers and maintainers to easily access. The items include information about HTTP requests and responses, informational logging (e.g. auth service sending a verification SMS) and errors that have happened as part of requests.
Application logs
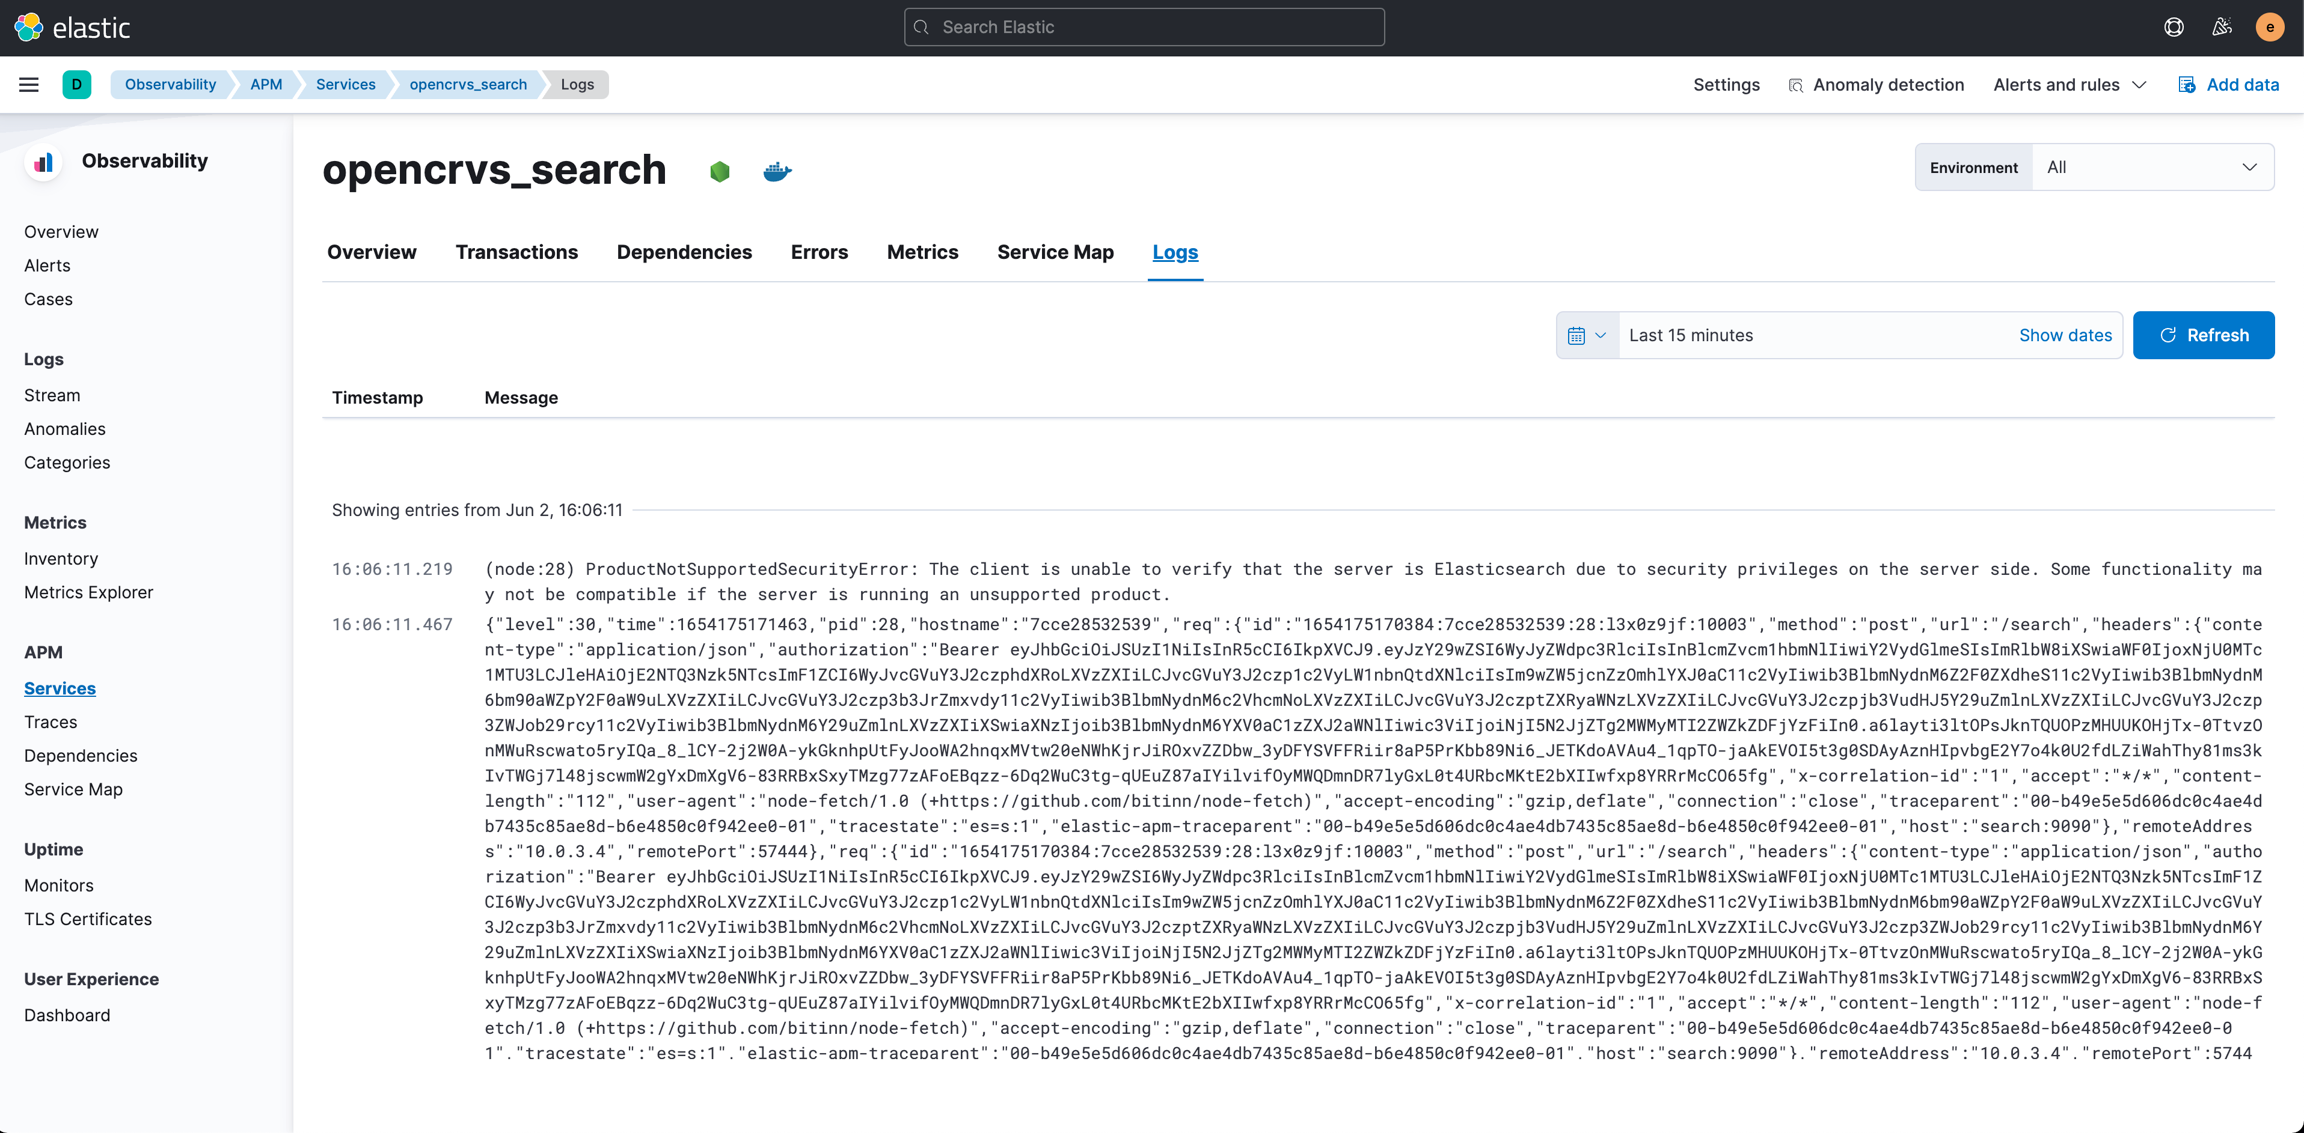
To access the logs of a specific service, first, log in to Kibana and navigate to Observability -> APM, open up the service you want to observe and navigate to the Logs - tab. In this view, you see the complete standard output of the microservice. You can also search log items by providing a time range.

Searching the logs
Log stream
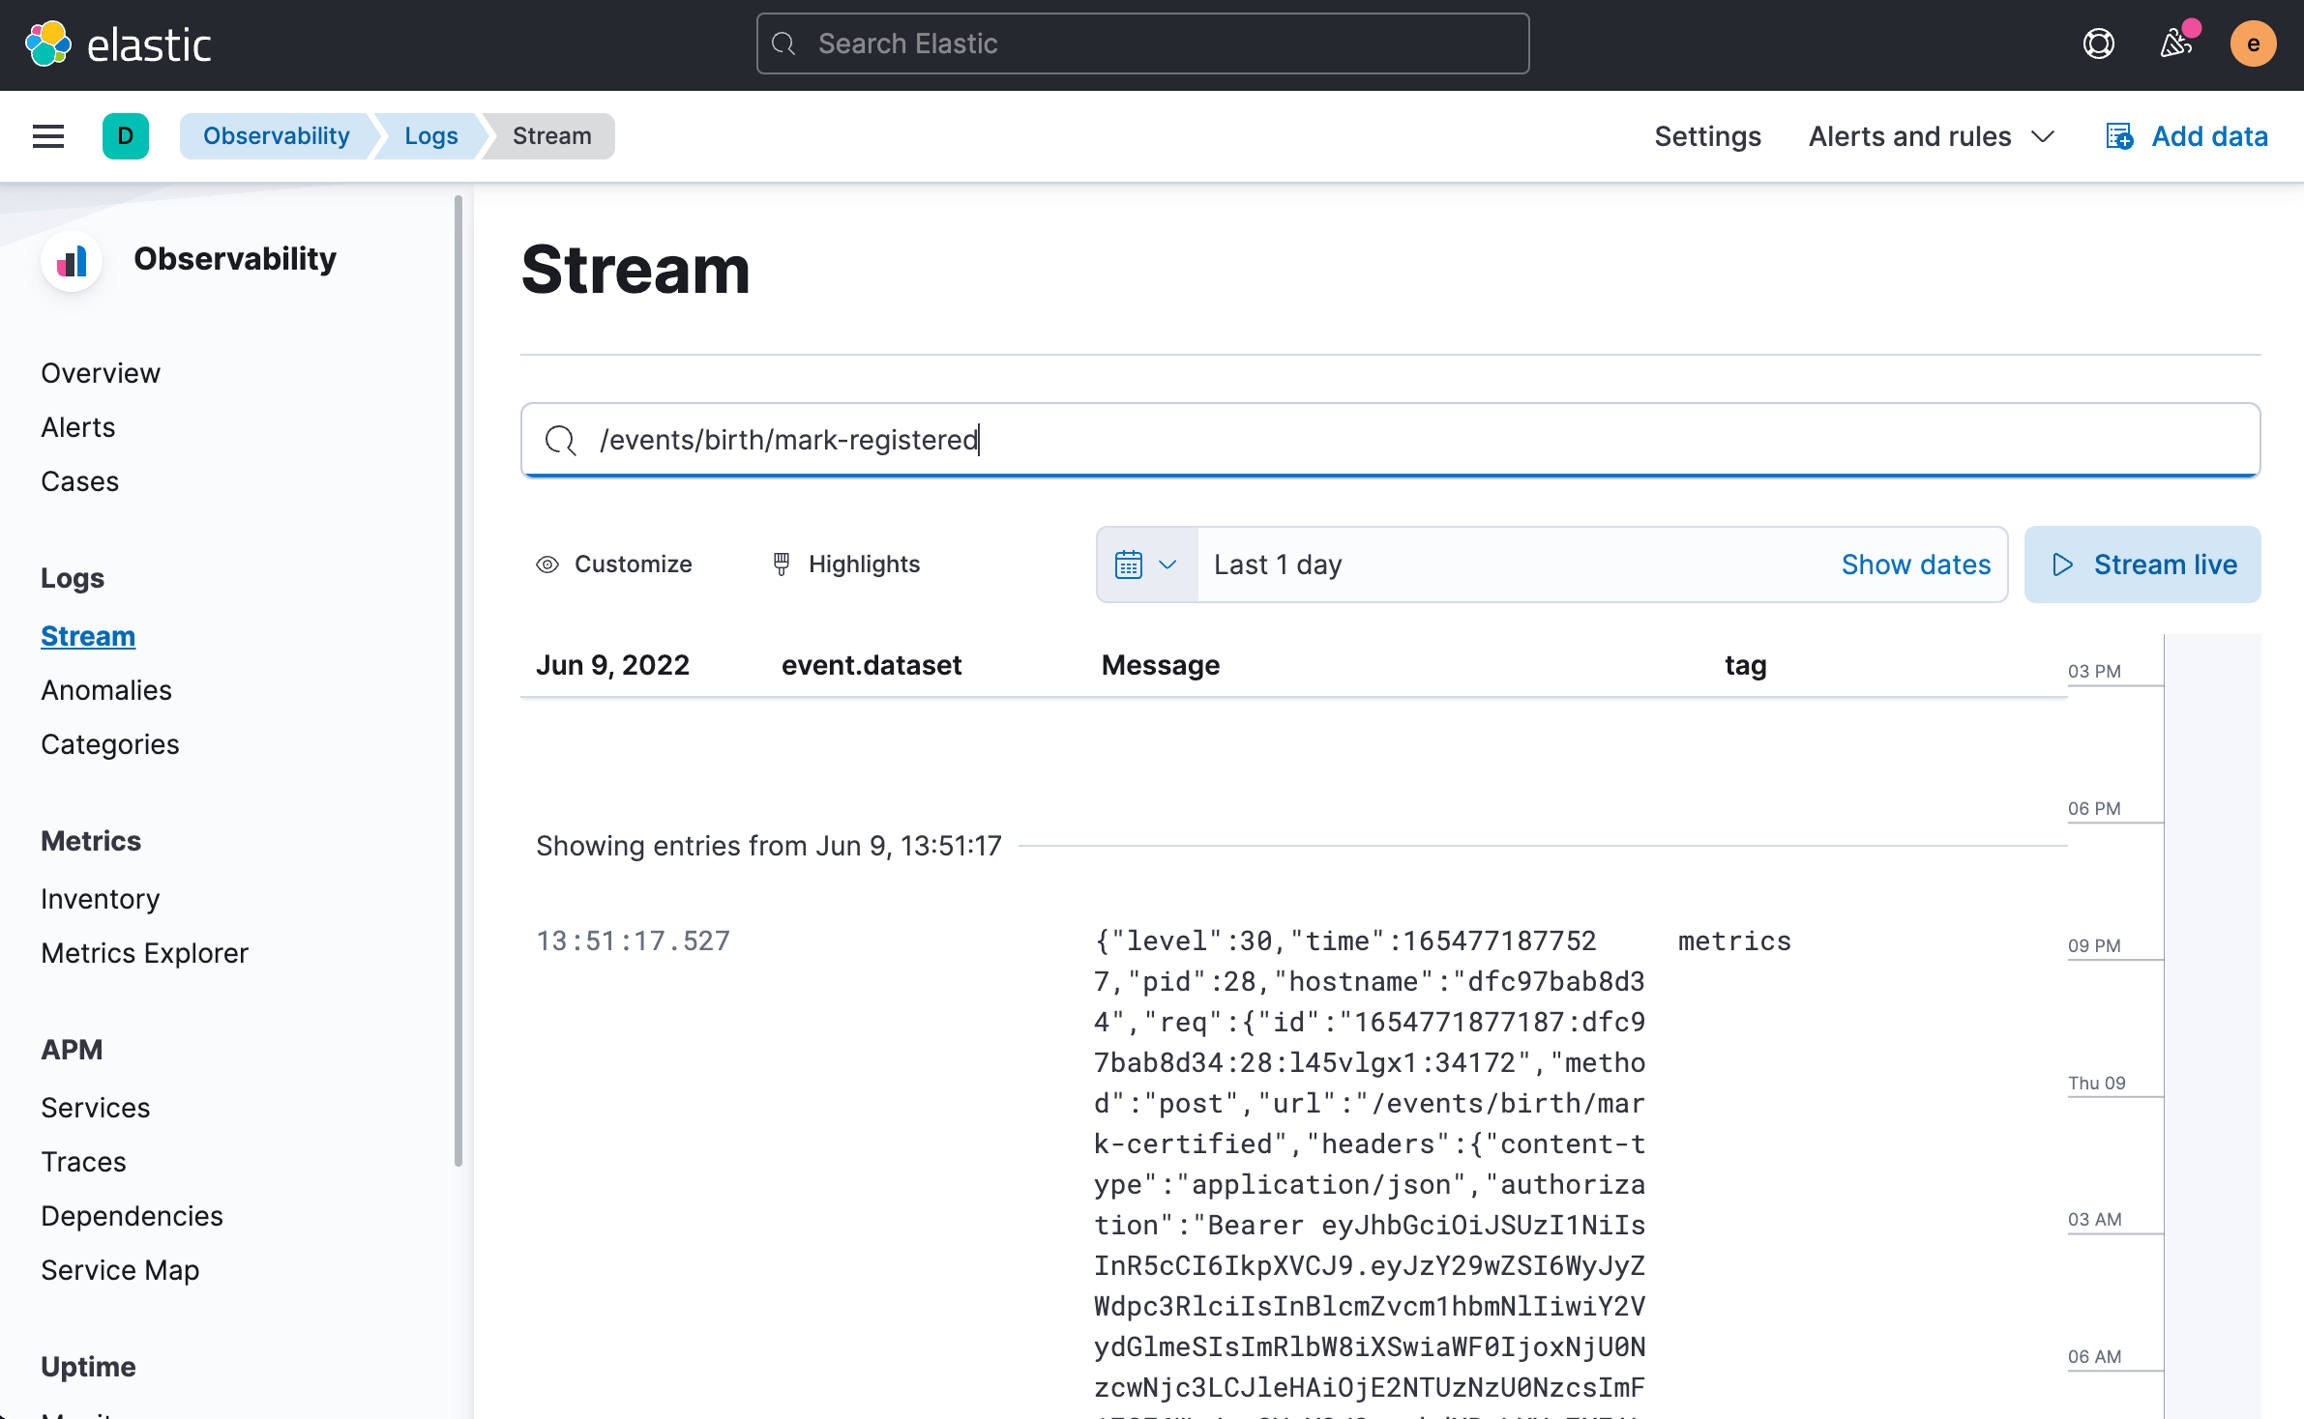
By navigating to Observability -> Logs -> Stream, you see all logs of all applications in real time. This view also lets you search for specific events happening in the stack during a specified time range and search terms like the request URL, header value or other values in the request or in the response object. More information about this view can be read here.

Tracing a request through different services
In the log stream view, you can see that all log items related to HTTP requests contain a header field called elastic-apm-traceparent.
This field is extremely useful for getting an understanding of everything that happened during the request's lifecycle. The second part of the id, 6be341213d9b92b6220d3f1b2eacbe84, be used for searching all requests related to this transaction.
Traces
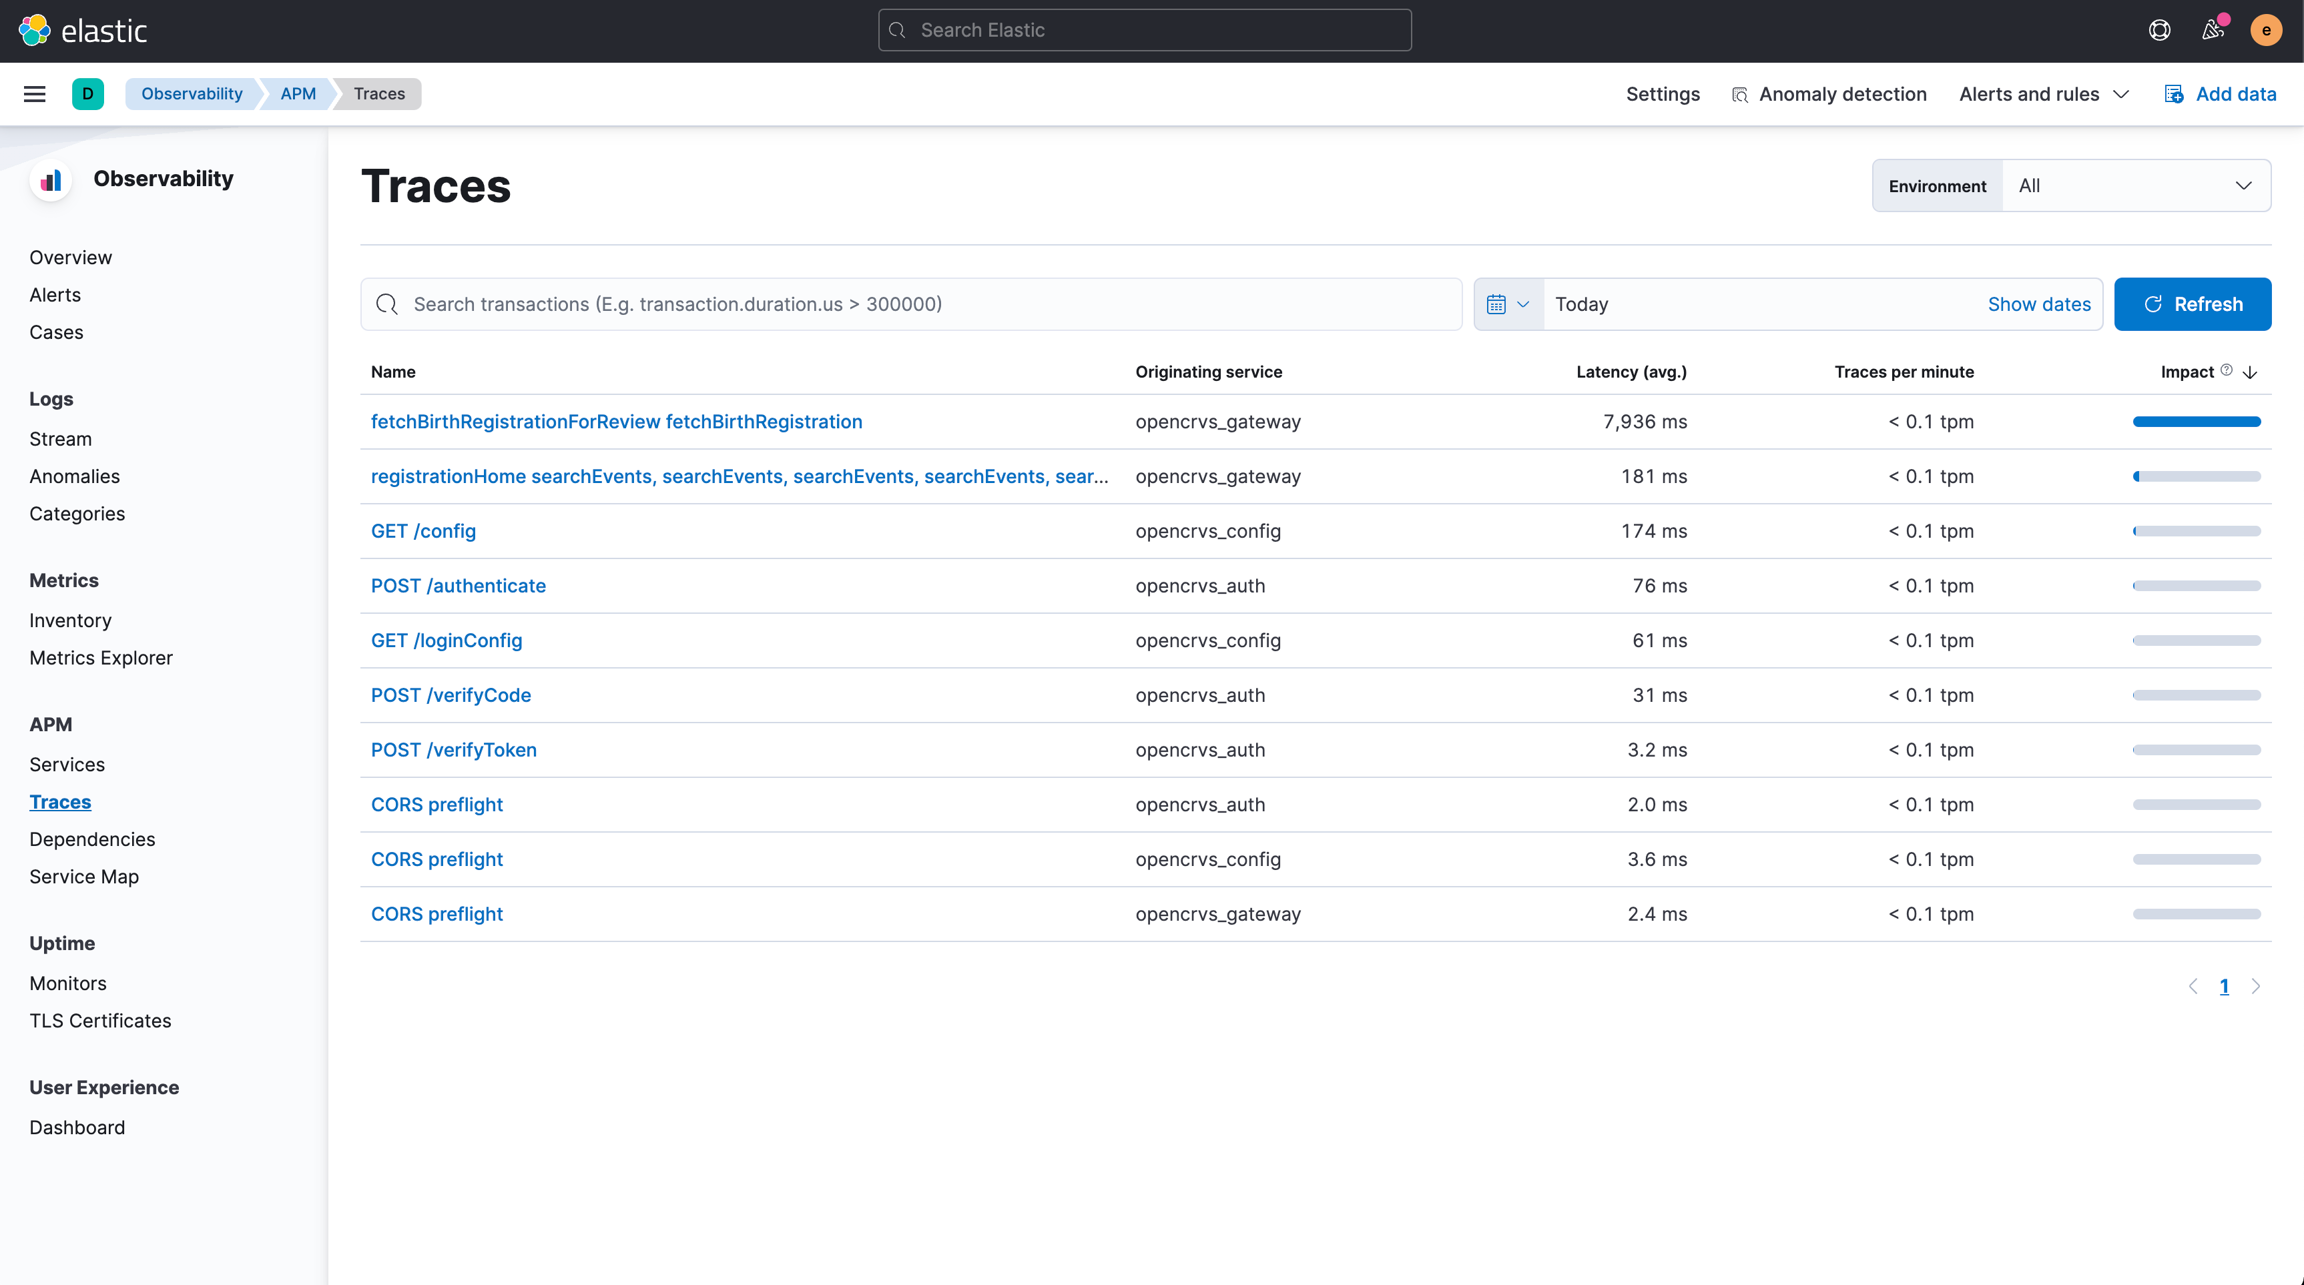
Another way of finding a specific request is by finding it through the Observability -> APM -> Traces view.

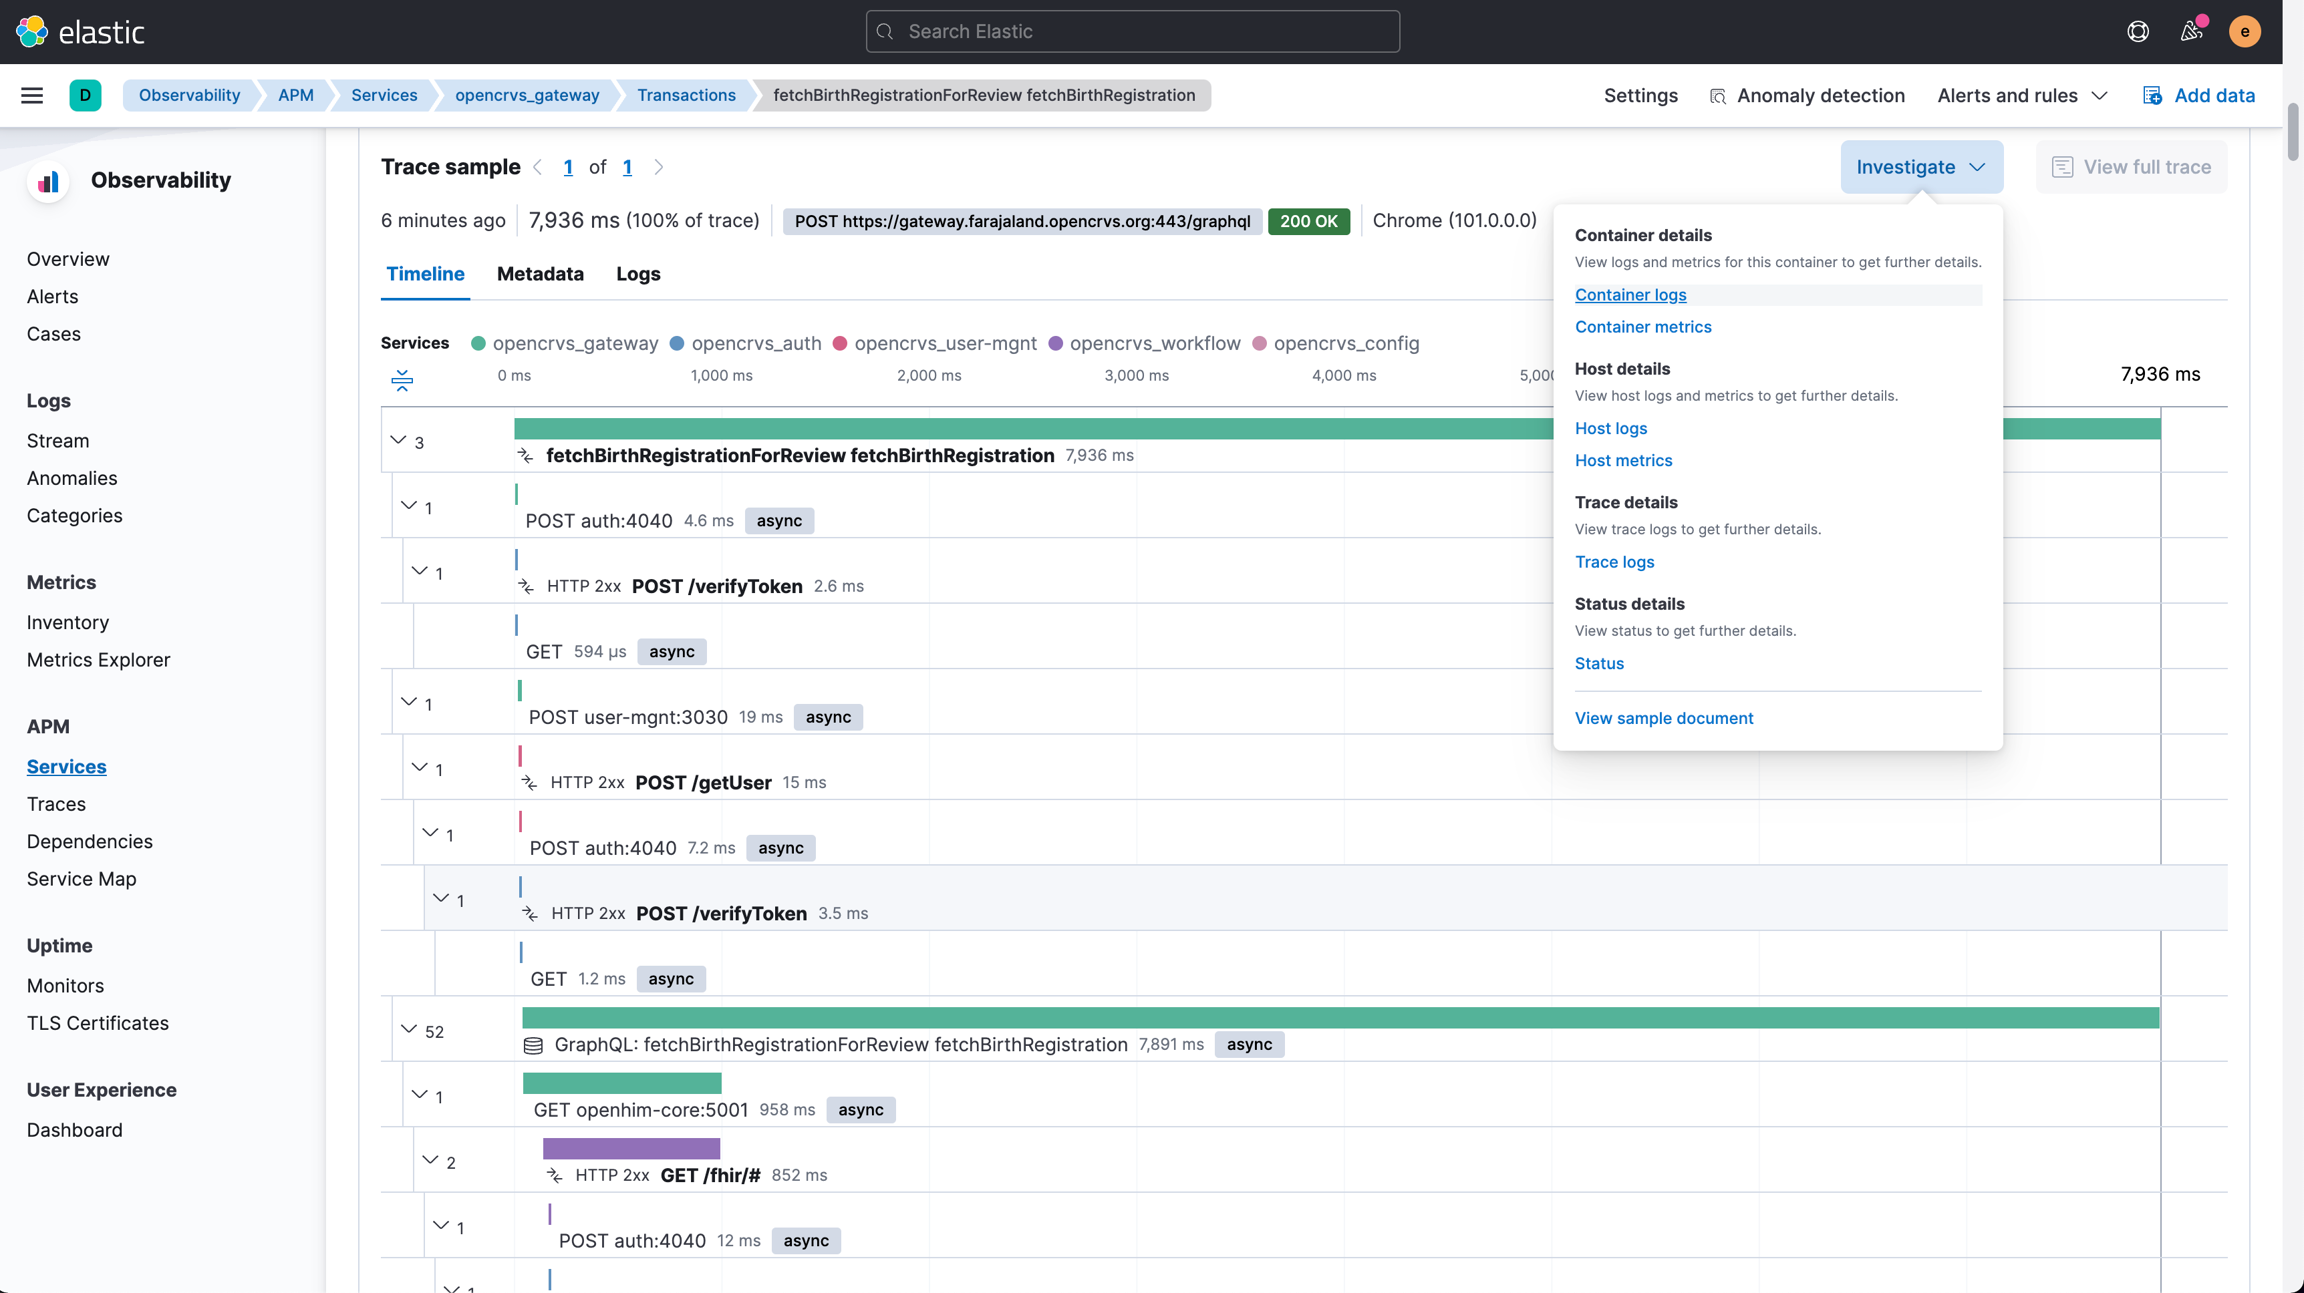
In this view, you can see all requests that happened in the selected time interval grouped by the type of the request. By clicking on the request type you are interested in observing, you can see for example the average timings and error rates for that request type. At the bottom of the page, you also see trace samples of all of the actual requests made during the specified time interval.
This is especially useful for figuring out in which service the request fails or for detecting bottlenecks in the architecture. By clicking on Investigate -> Trace logs you can navigate back to the logs view to see all logs corresponding to the selected request.

Read more:
Last updated